
- Published on
- •2 min read
Server Monitor: Building an Agentless, Self-Hosted Monitor for Linux Servers
- Authors

- Name
- Pulathisi Kariyawasam
Introduction
Most monitoring tools expect you to install an agent on every server, and many of them also expect a cloud service or a package repository to be reachable. That does not fit every environment. Some teams do not want extra software running on production machines, some networks are isolated on purpose, and for a small group of servers a full monitoring stack is often more work than the problem it solves. In those cases people tend to fall back to logging in to each server by hand and running df and top.
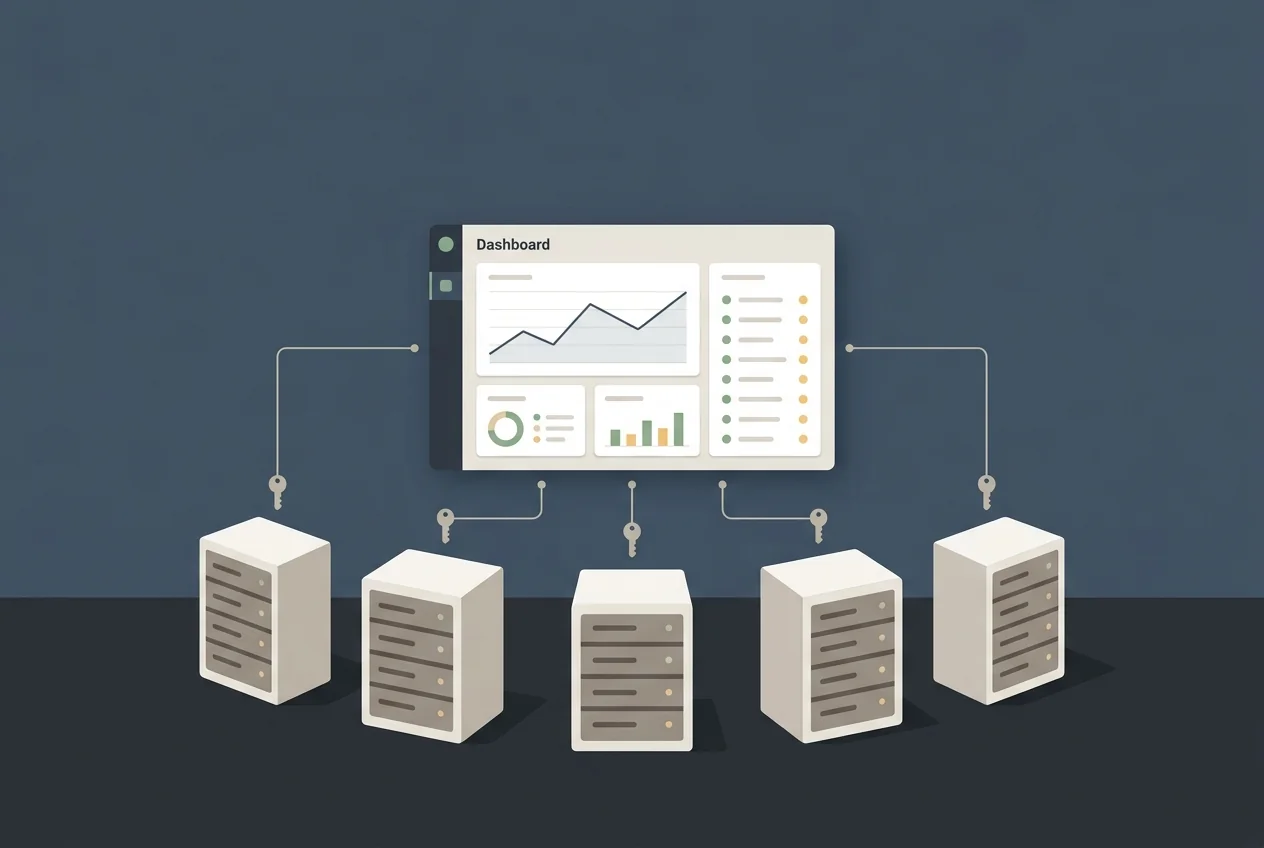
I wanted something in between, so I built Server Monitor - a small web application that watches Linux servers over SSH only. Nothing is installed on the monitored servers, it does not depend on any outside service, and the monitor itself can be deployed as a single file. I designed the system - what is collected, how it is stored, where the security boundaries are - and used an AI coding agent to help implement it, the same way I have worked on my last few projects.
What It Does
- Watches servers without an agent - it logs in over SSH and runs one fixed, read-only script built from tools every Linux install already has
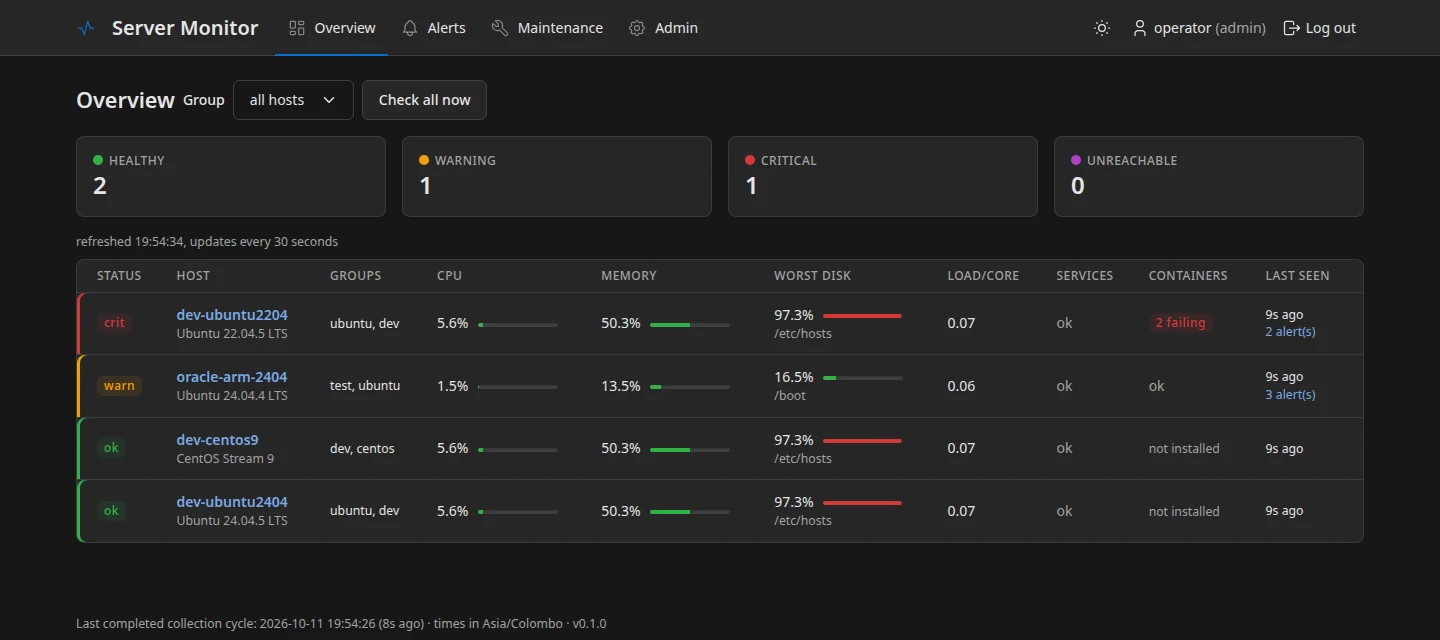
- Collects the basics - CPU, memory, swap, load, disks, uptime and reboots, systemd services, Docker containers, logins, top processes, pending OS updates and clock drift
- Predicts problems - estimates when a disk will be full and warns about bursts of failed SSH logins
- Detects changes - a new listening port, a new user account, or a new member of
sudoordockerraises an alert until an admin accepts it - Sends alerts by email and Telegram, with recovery messages, reminders, quiet hours and maintenance windows
- Runs offline - as a Docker image, or as a tarball that uses the server's own
python3with no pip and no internet
Backend Design
The backend is Python with FastAPI, asyncssh and SQLite.
Collection is one SSH connection per server. The monitor sends a single shell script on standard input, and the script prints everything in one go, split into marked sections. Each section has its own small parser, which is a plain function that takes text and returns data. That made the parsers easy to test with output captured from real machines. The script only reads: /proc, df, systemctl, docker ps, ss and similar. There is no way to run any other command from the web interface.
Storage is a single SQLite file. For ten to fifty servers collected once a minute that is more than enough, and it means there is no database server to install and look after on a closed network. Raw samples are kept for a week, then rolled up into hourly values for the charts.
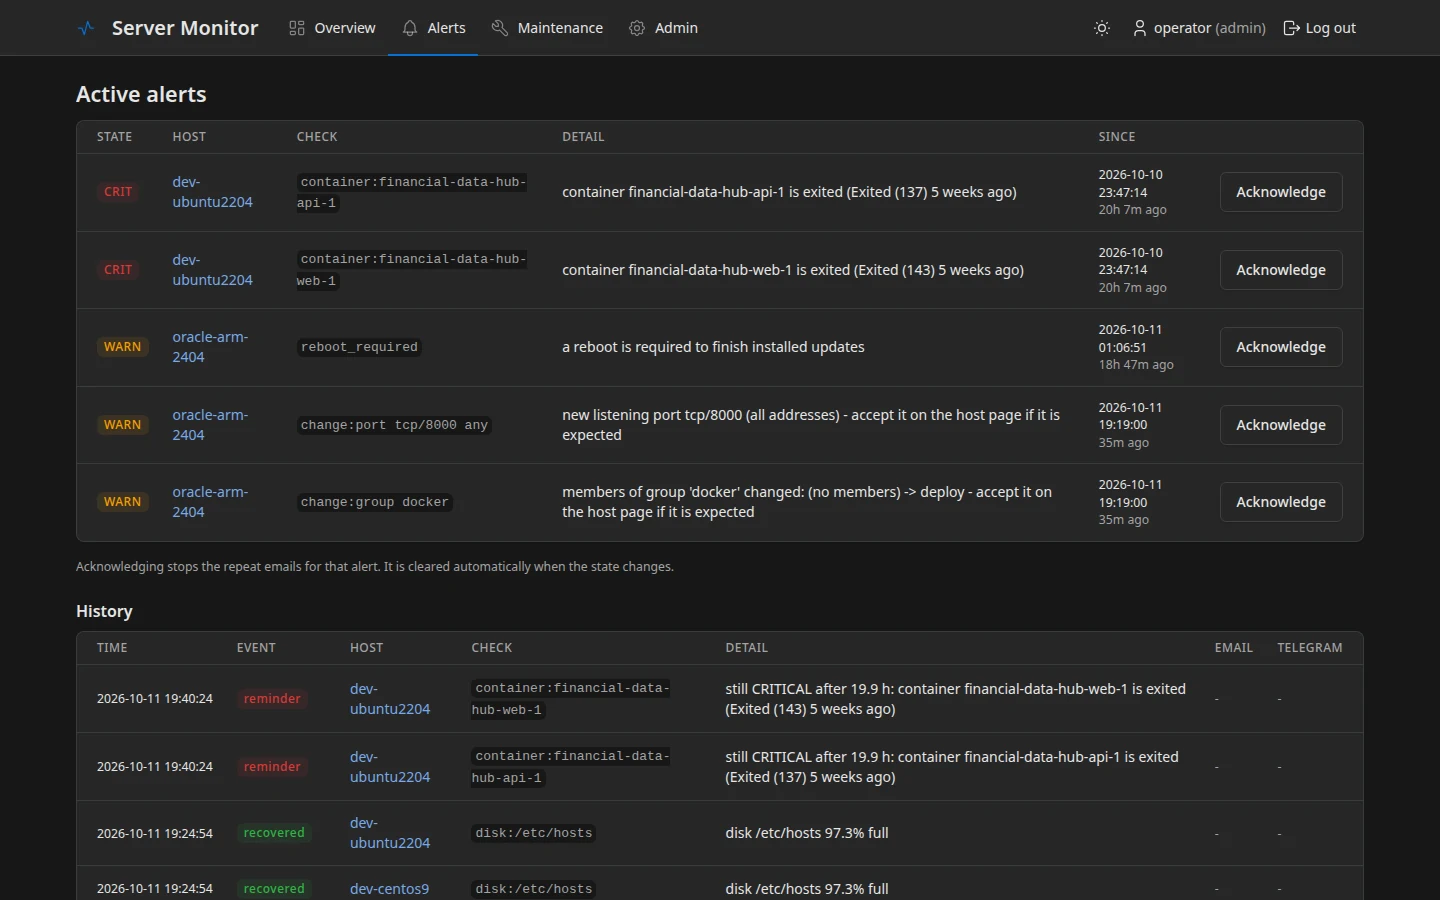
Alerting is a small state machine. A value has to be bad three times in a row before an alert opens, so one busy minute does not wake anyone up. Each alert also sends a recovery message when it closes, and critical ones repeat until someone acknowledges them.
Host Page
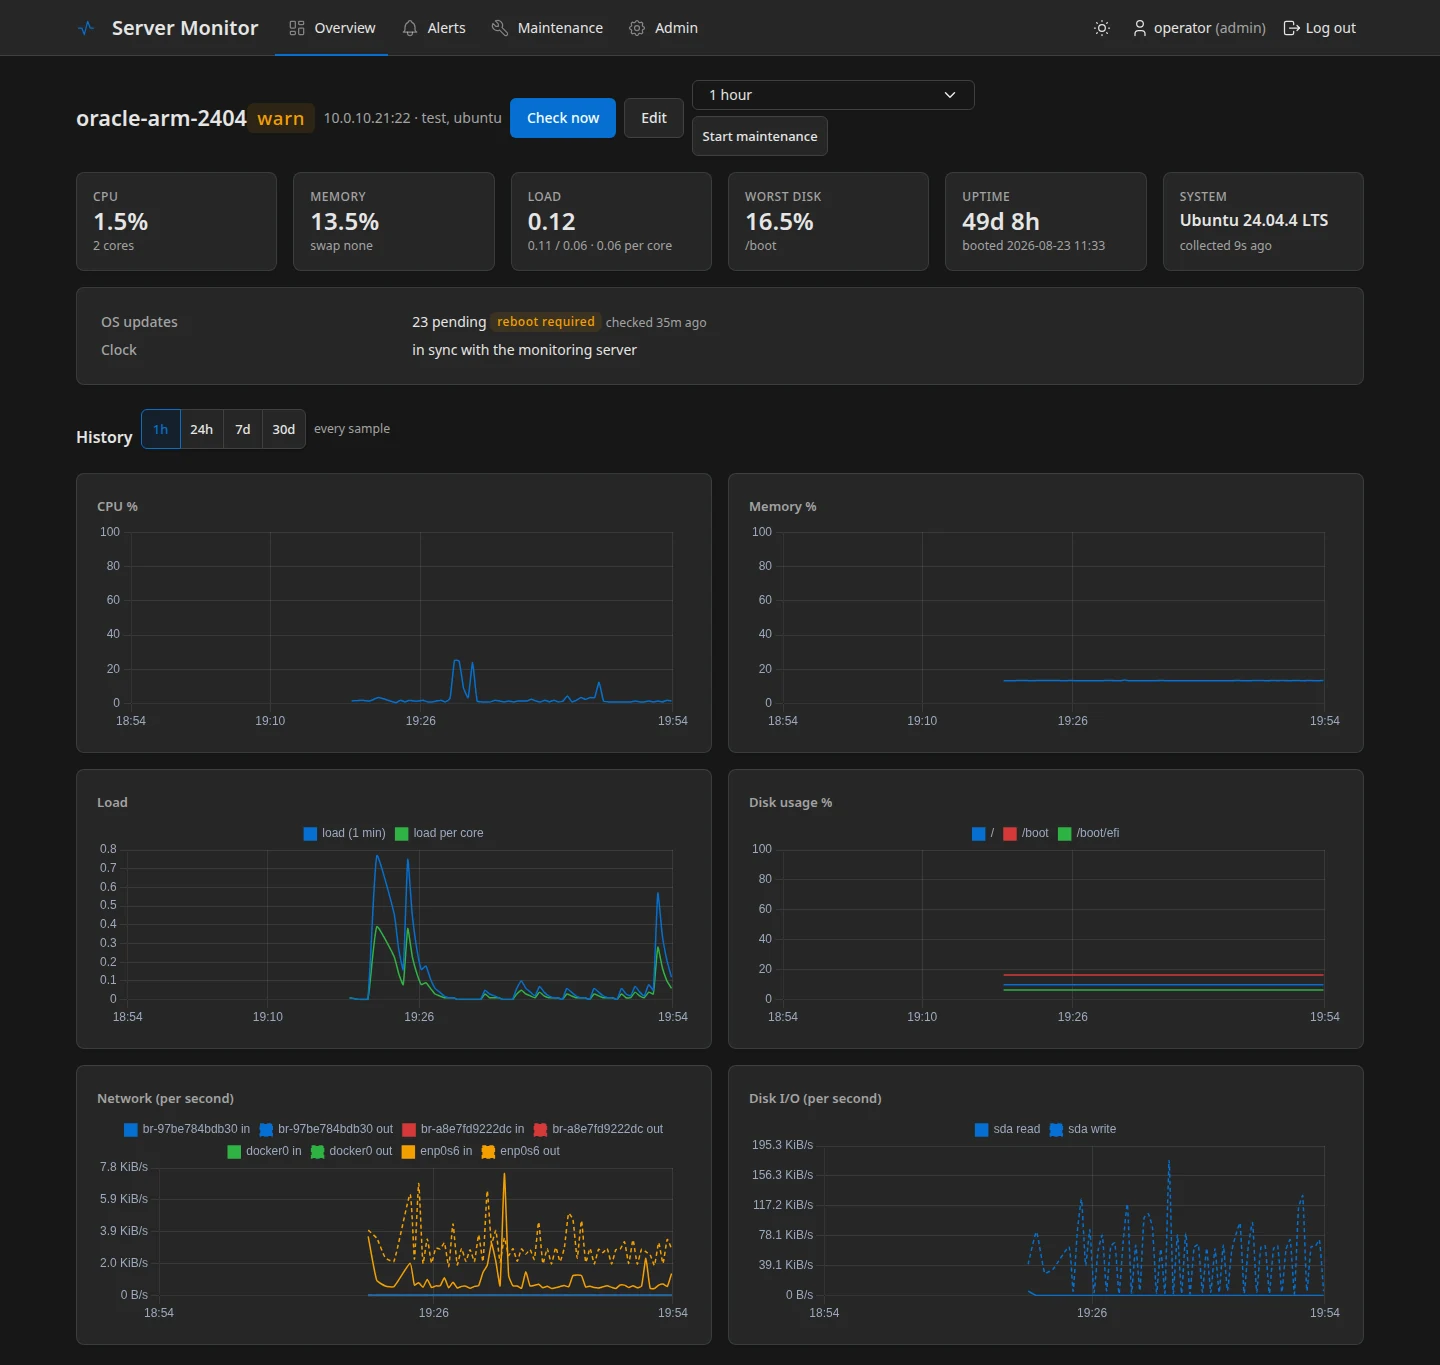
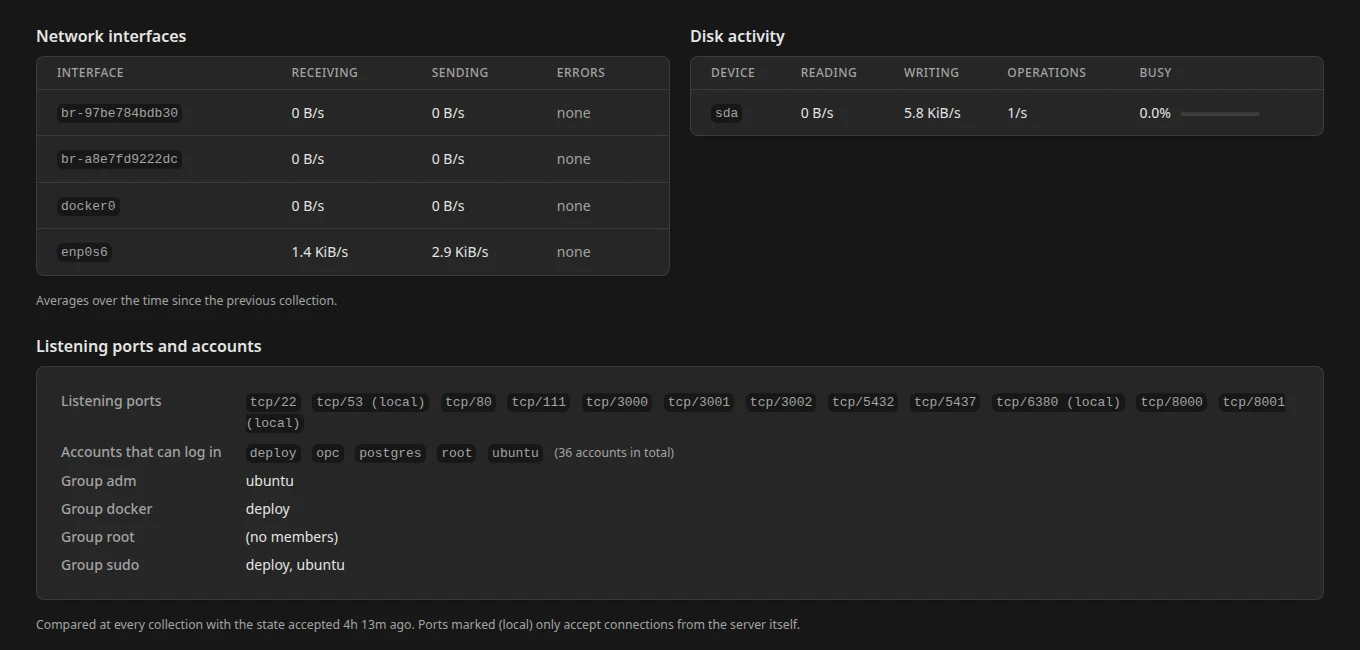
Every server has its own page with the current numbers, history charts, disks, top processes, containers and recent logins. Network throughput and disk I/O are worked out from the kernel counters, by comparing each collection with the one before it.
Change Detection
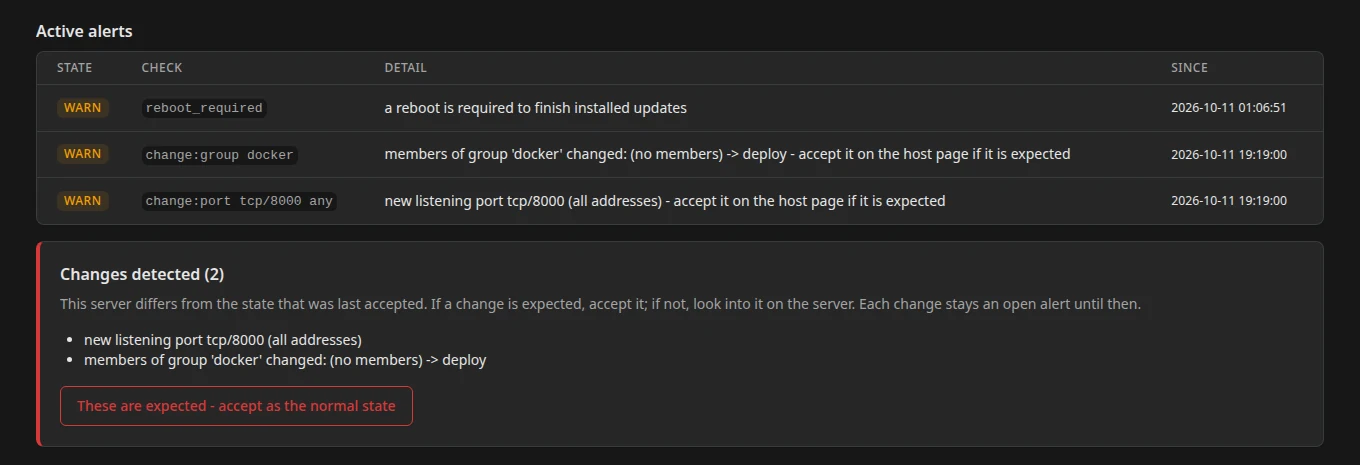
This is the feature I find most useful for security. The first collection of a server is saved as its normal state. After that, every collection is compared with it. If a new port starts listening, or someone is added to the docker group, the host page shows exactly what changed and an alert stays open until an admin looks at it and accepts it. Accepting is written to the audit log with the admin's name.
The same data gives a simple inventory for each server: which ports are open, which accounts can log in, and who is in the privileged groups.
Security Decisions
A tool that holds SSH access to every server is a target itself, so most of my design time went here:
- SSH host keys are checked. The first connection saves the key. If it changes later, the monitor stops collecting from that server and raises an alert until an admin accepts the new key.
- Secrets are encrypted with a key that lives in a separate file, not in the database. Passwords and private keys are never shown again in the interface, only replaced.
- Logins are protected with argon2 password hashing, CSRF tokens on every form, lockout after failed attempts and an audit log of every admin action.
- No outside assets. The interface loads no scripts or styles from a CDN, and has a strict content security policy.
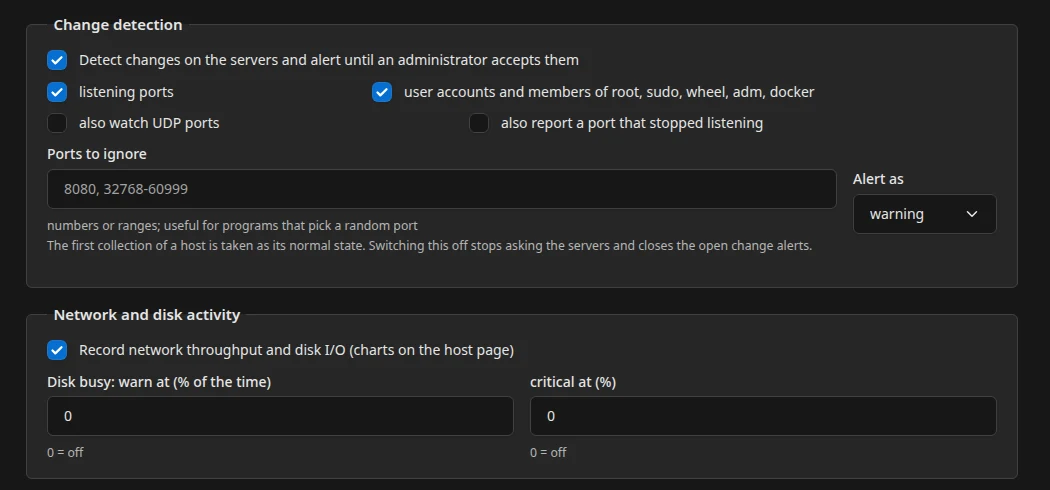
Every feature can also be switched off in the settings, so the monitor only asks the servers for what you actually want.
AI-Assisted Development Experience
I built this with an AI coding agent doing most of the implementation, while I stayed in the architect and reviewer seat - writing the specification, setting the security rules, and deciding which features were worth having.
It helped most with the repetitive parts: a parser for each command, the admin screens, the test suite of more than 300 tests. The part that needed a real machine was testing. The project was tested against a few throwaway containers running different Linux distributions, and one real ARM server.
Conclusion
Server Monitor is not a replacement for a large monitoring stack. It is for the case where you have a handful of servers and want to see their health without installing anything on them or depending on an outside service.
The interesting part of the project was not collecting numbers. It was deciding the limits: only read-only commands, nothing installed on the servers, refuse to connect when a host key changes, and never show a secret again once it is saved.